
CNN’s Harry Enten Examines Thousands of Polls as Trump’s Approval Ratings Fall Ahead of 2026 Midterms
With the November elections approaching, CNN’s chief data analyst has unveiled an extensive analysis of America’s political landscape, examining thousands of polling data points, shifting voter coalitions, and battleground Senate races as Republicans confront mounting public dissatisfaction with President Donald Trump.
CNN’s Massive Midterm Analysis Reveals a Changing Political Landscape
With fewer than four weeks remaining before the November 3 midterm elections, CNN chief data analyst Harry Enten has released an extensive examination of the polling data shaping the battle for control of Congress. The analysis, presented in an October 11 installment of The Enten Scale, draws on thousands of polling data points from competitive states, historical election patterns, presidential approval ratings, and voter demographic trends to explore how the political environment has changed since Donald Trump’s return to the White House.
The findings arrive amid a series of national surveys documenting declining approval of Trump’s performance, particularly on the economy, inflation, and other issues that have become central to the 2026 campaign. Recent polling also shows changes among independents, Hispanic voters, younger Americans, and portions of the coalition that helped Trump win the 2024 presidential election. Although the precise electoral consequences remain uncertain, the measurements have intensified scrutiny of Republican congressional candidates attempting to defend their seats in an increasingly competitive political environment.
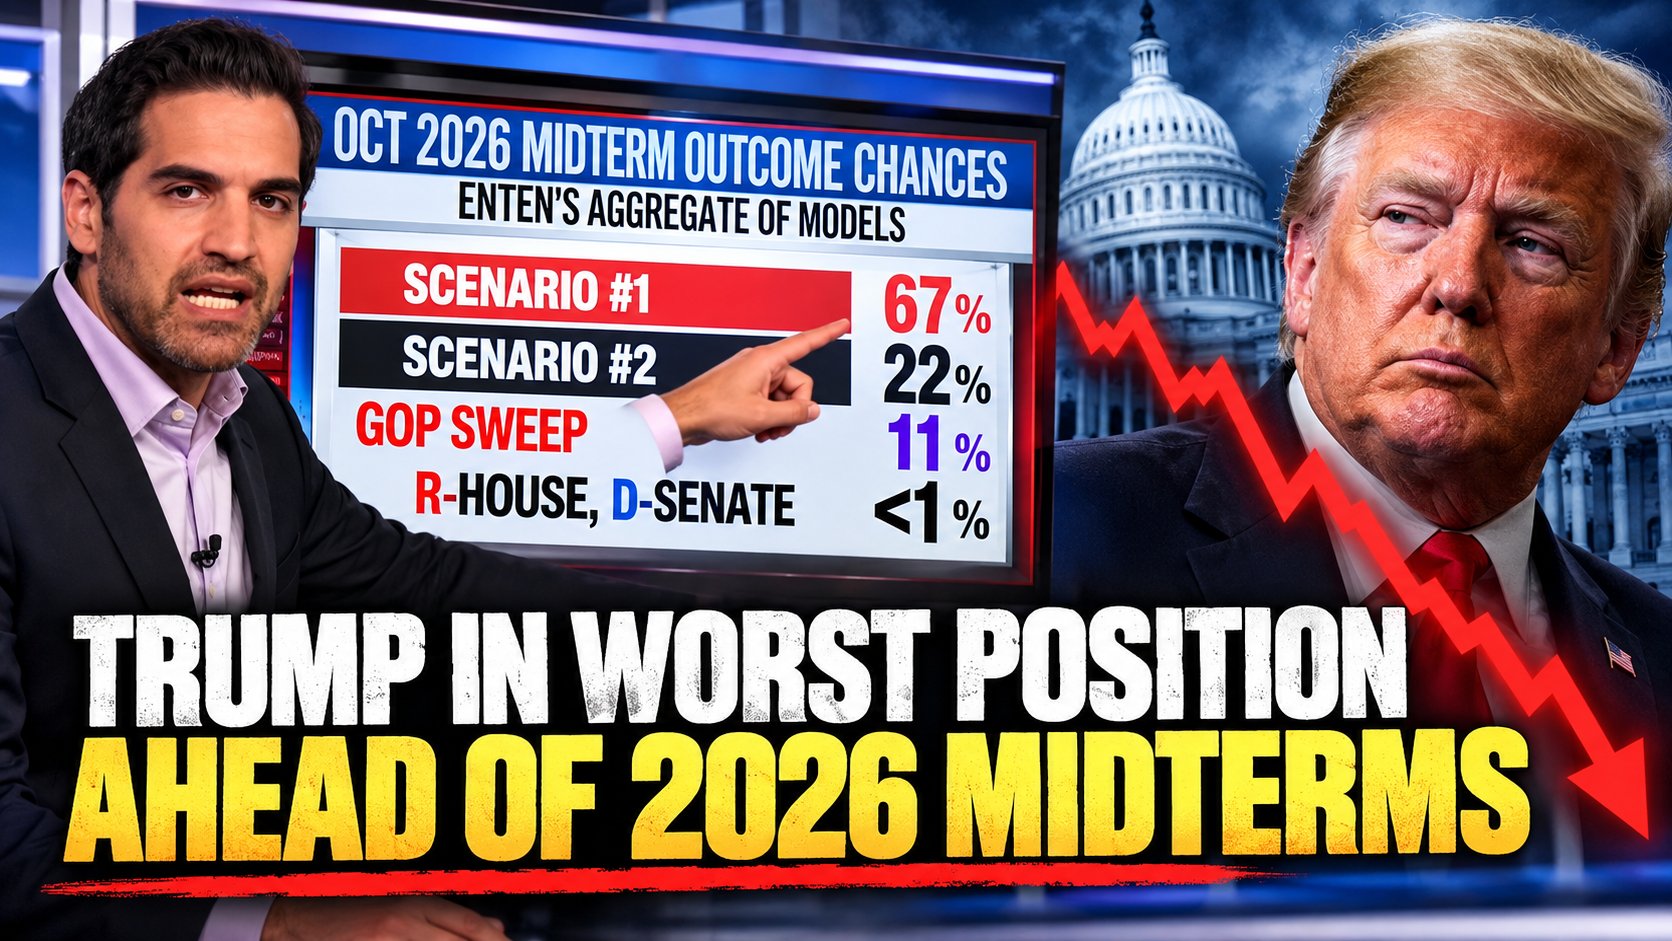
Enten’s presentation examines multiple possible configurations of the next Congress, beginning with less common scenarios before reviewing the central forecast produced by his analysis. The exercise illustrates the difference between individual polls, which measure voter preferences at a particular moment, and election models, which combine numerous measurements with assumptions about turnout, uncertainty, and the relationship between public opinion and actual election results.
Trump’s Approval Ratings Have Fallen Sharply Across Multiple National Polls
The broader polling environment underlying Enten’s analysis has become increasingly unfavorable for Trump. A Pew Research Center survey conducted September 28 through October 4 measured the president’s job approval at 30%, with 68% disapproving, producing a net approval rating of negative 38 percentage points. The survey included 5,062 adults and carried a reported margin of error of approximately 1.6 percentage points, placing the results among the most substantial recent national measurements of public sentiment toward the administration.
Other national surveys have documented similarly low approval ratings, although the exact figures vary depending on polling methods and the populations surveyed. A Reuters/Ipsos poll conducted September 30 through October 5 found 32% approval and 65% disapproval among American adults, while an AP-NORC survey conducted in late September measured approval at 31%. CBS News/YouGov reported a higher approval figure of 39%, illustrating that polling organizations can produce meaningfully different results even when measuring the same presidency during approximately the same period.
Enten has emphasized the historical significance of the negative approval figures, comparing Trump’s current standing with the political conditions experienced by previous presidents before midterm elections. Such comparisons offer important context because midterms frequently become referendums on the party occupying the White House, although presidential popularity alone cannot determine the outcome of hundreds of individual congressional contests.
Independents and Younger Voters Show Significant Movement
One of the most consequential developments in the recent polling involves independent voters, whose preferences can substantially influence closely contested congressional races. National surveys have documented substantial dissatisfaction with Trump’s performance among independents, while polling of the congressional ballot has shown Democrats holding an advantage among respondents who do not identify with either major party.
A Reuters/Ipsos survey released October 5 found Democrats leading Republicans by 44% to 37% among registered voters nationally. Among independents, 37% preferred Democratic congressional candidates compared with 21% supporting Republicans, while 28% remained undecided. Those figures illustrate both the current Democratic advantage in the survey and the considerable uncertainty remaining among voters who could affect close contests.
Enten has also highlighted a pronounced decline in Trump’s standing among Americans ages 30 to 44, a demographic that includes much of the millennial generation. According to aggregate polling presented by CNN, Trump’s net standing with that age group was approximately five points positive around the 2024 election but had fallen to 36 points negative by early October 2026, a 41 point deterioration. The movement is particularly notable because younger and middle aged voters have become increasingly important in competitive suburban districts and statewide elections, where relatively small changes in turnout or party preference can have significant consequences.
Hispanic Voters and the Economy Add Another Complication
Hispanic voters represent another important part of the changing electoral landscape. Trump made substantial gains with Hispanic voters during the 2024 presidential election, particularly among some working class and male voters, but recent polling indicates that his approval has declined considerably within the demographic. The October Reuters/Ipsos survey found that 24% of Hispanic adults approved of his performance, while the congressional ballot question showed 52% of Hispanic registered voters supporting Democrats and 26% supporting Republicans.
These changes are particularly relevant in states such as Florida, Texas, Arizona, and Nevada, where Hispanic voters represent substantial portions of the electorate but differ widely in national origin, political affiliation, income, and local concerns. In South Florida, Cuban American, Venezuelan American, Colombian American, Puerto Rican, and other Hispanic communities have distinct political histories, making it difficult to translate a single national demographic trend into a reliable prediction for individual districts.
Economic dissatisfaction remains an important factor across these groups. Recent surveys have identified the cost of living as a leading concern, with voters expressing frustration over inflation, housing affordability, and household expenses. The political implications extend beyond whether Americans believe the economy is growing, because voters often evaluate presidential performance through their own purchasing power, job security, and ability to afford essential goods and services.
Battleground Senate Races Put Candidate Popularity Under the Microscope
Enten’s analysis also examines Senate contests in states including Ohio, Kansas, Iowa, Alaska, Michigan, Maine, North Carolina, and Texas, where statewide political conditions and individual candidates are producing different electoral dynamics. The Senate is especially important because its members serve six-year terms, and the relatively small number of seats contested in any single election means that individual state races can have an outsized effect on congressional control.
In Ohio, Enten highlighted polling showing Republican Sen. Jon Husted with a net favorability rating 13 percentage points below zero. He also discussed Texas Attorney General Ken Paxton, whose net favorability was reported at negative 16 points in the context of the state’s Senate contest. Such figures matter because a candidate’s personal reputation can differ substantially from the popularity of the party they represent, particularly when voters are weighing concerns about character, policy positions, and national political conditions.
Kansas has also attracted unusual attention after surveys showed a competitive Senate contest in a state with a long history of Republican representation. The state has not elected a Democrat to the U.S. Senate since 1932, making the recent polling notable as a measurement of political sentiment rather than proof of an impending partisan realignment. In other states, including Alaska and Iowa, analysts are examining whether changes in presidential approval and candidate perceptions are being reflected in statewide surveys.
Republican Voter Registration Gains Complicate the National Polling Picture
Despite the unfavorable national approval figures, not every political indicator has moved in the same direction. During a separate October 7 CNN analysis, Enten examined voter registration records showing that Republicans have improved their registration position relative to Democrats in several presidential battleground states over the past eight years. Compared with the 2018 midterms, the Republican registration margin improved by four percentage points in Arizona, five in Nevada, seven in Pennsylvania, and eight in North Carolina.
Those registration figures provide an important counterpoint to national opinion polling. Party registration measures the formal affiliations of voters, while opinion surveys measure attitudes and intended voting behavior. A state can experience long-term Republican registration gains while simultaneously recording short-term Democratic improvements in public opinion, particularly when independents and less politically engaged voters change their preferences.
Florida illustrates the distinction especially clearly. Republicans have substantially expanded their registration advantage in the state, changing a political environment that was once characterized by extremely narrow statewide election margins. Enten’s October 7 discussion highlighted that structural shift, demonstrating why national political trends cannot automatically be applied to individual states or congressional districts.
The Economy and Inflation Remain Central to the Election
The president’s handling of inflation has become a particularly prominent component of Enten’s analysis. In his October 11 presentation, he highlighted polling that placed Trump’s net approval on inflation at negative 56 percentage points, reflecting substantial public dissatisfaction with an issue that affects household budgets across income levels and geographic regions.
The significance of inflation extends beyond a single economic statistic. Even when the rate of price increases slows, consumers continue paying the higher prices established during previous periods of inflation unless prices actually decline. That distinction helps explain why improvements in certain economic indicators do not necessarily translate into improved public perceptions of affordability.
For congressional candidates, the political challenge involves separating their own economic proposals from public evaluations of the president and the administration. Republican candidates have emphasized their positions on taxation, regulation, immigration, and economic growth, while Democratic candidates have focused on affordability, government accountability, and criticism of the administration’s economic policies. Whether voters prioritize national economic conditions, local issues, or individual candidates will vary across districts.
Why Thousands of Polling Data Points Still Cannot Guarantee an Election Result
Enten’s October 11 presentation included several modeled election scenarios, including one assigned an 11% probability, before identifying the central outcome in his forecast. The scenarios were intended to illustrate how different combinations of state and congressional results could alter control of the House and Senate, rather than establish the results of an election that has not yet occurred.
Polling models can be useful for identifying uncertainty, but their reliability depends on the quality of the underlying surveys and the assumptions used to combine them. Pollsters must estimate which registered voters will actually participate, account for demographic differences, and correct for survey nonresponse. Small errors repeated across several competitive states can produce substantially different congressional outcomes from those suggested by a national polling average.
Recent American elections have demonstrated why those limitations deserve attention. Polling errors in 2016, 2020, and 2024 generated considerable debate about whether some Republican voters were being adequately represented in surveys. Analysts have continued refining their methods, but no statistical adjustment can eliminate uncertainty about future turnout, late campaign developments, or the decisions of undecided voters.
What the Midterm Results Could Mean for Trump’s Final Two Years
The November 3 elections will determine the composition of Congress during the final two years of Trump’s second presidential term. Control of the House and Senate affects federal spending, legislative priorities, oversight investigations, judicial confirmations, Cabinet appointments, and the ability of either party to advance or block major policy initiatives.
If the House changes party control, its leadership and committee structure would change accordingly, potentially altering the administration’s legislative agenda and the intensity of congressional oversight. A change in Senate control would have additional consequences for confirmations and committee leadership. Divided control of Congress, meanwhile, would create a different governing environment, requiring negotiations between parties with competing priorities.
The broader significance of Enten’s analysis lies in the contrast between the political coalition that returned Trump to office in 2024 and the public opinion measurements recorded less than two years later. National approval surveys, voter registration records, congressional ballot polling, and candidate-specific data are telling different but overlapping stories about the electorate. Understanding those distinctions is essential to interpreting the campaign without confusing statistical estimates with actual election results.
With Election Day approaching, the remaining questions concern which voters will participate, whether undecided Americans will settle on candidates, and how accurately current polling reflects the electorate that ultimately casts ballots. Enten’s analysis provides an extensive statistical picture of the campaign as of early October, but the final composition of Congress will be determined by voters on November 3.

Sources & Further Reading
- CNN — Harry Enten’s October 11 Midterm Analysis (Full Video)
- CNN — The Enten Scale
- Mediaite — CNN Chief Data Analyst Harry Enten’s Midterm Forecast
- Reuters — Trump Approval at Record Low; Hispanic Voters Sour on Republicans
- Reuters — Trump Voters’ Midterm Enthusiasm
- CNN — October 7 Transcript on Voter Registration and Midterm Trends
- Axios — Polling Uncertainty and Republican Survey Participation
- CNN — October 8 Transcript on Millennial Voter Approval


















































Want to join the conversation?
Create an account or sign in to share your thoughts, vote,
and reply to other readers.
Showing 0 of 0 comments
Don't have an account?
Already have an account?